

Here’s why 7-Day ROAS is close but no cigar for marketing & growth teams in casual gaming
November 24, 2021
.jpeg)

Honestly, the metric of 7-day ROAS needs to be retired. And maybe even set on fire. Well no, I take that back—but it absolutely shouldn’t be the default. It’s far too limiting, and unrealistic for the growth teams behind apps.
A quick dive into why 7-day ROAS is insufficient for apps
The brief window of seven days doesn’t allow campaigns for apps to target their full potential. As a result, it ends up creating fierce competition between other publishers in the space, and brands end up missing out on a significant portion of their potential audience and revenue.
Take casual gaming brands, for example. They tend to optimize for 1 or 7-day ROAS, but this short-term optimization goal offers skewed measurements. Most gamers need time to learn the game mechanics and reach a point where they want to accelerate their experience with a purchase. This often takes more than a week, so the 7-day optimization timeframe is hardly effective in identifying a desirable audience.
This ties into game economies, and how long it takes to purchase. Your game economy determines the success of the monetization element, but there are some considerations. For instance, does your game push users to purchase early, or does it take longer for users to purchase? Does it push to repeat purchases? Do users who purchase early also tend to continue purchasing later on?
Understanding your ROAS curve is very important, and it will allow your marketing team to move from 1 day or 7 day optimization, to long term. But that is only the start. The monetization type should also be considered. Is your game monetizing on app purchases, from ad revenue, or both? There's also the issue that cohort-level statistics for ROAS don't reveal the full implications of the chosen game economics. For example, user level correlation between early revenue and later revenue will tell you if the ROAS curve is driven by the same users that purchased at a high price and keep purchasing, new first time depositors, or users that make frequent small purchases at a steady pace. This collectively has implications on your marketing optimization strategy.
I know all this sounds like a lot, and that’s because it is. There are lots of nuances to consider here. So with that in mind, I’m going to talk more about the different aspects of ROAS, from monetization, to the game economy (and its subsets of user segments and behavior), and channels and devices.
A deep dive into the many aspects of ROAS
You see, if you’re monetizing on app purchases alone, your ROAS per specific cohort will eventually flatline—or get pretty darn close to flatlining. It’ll be much like the graph below

If you’re monetizing from ad revenue, the curve will be much closer to linear line - and will last longer. The majority of casual gaming apps use a model combining revenue from both. Here’s how to calculate combined ROAS goals:
- Calculate separate LTV curves for IAP and user-level ad revenue.
- Determine the margin goal based on the curves’ behavior to maximize profit.
- Determine daily ROAS goals by dividing each day’s ARPU (IAP + ad revenue) by the total LTV to define your combined Day 7 ROAS goal.
Note: There will be plenty of users who don’t purchase from your game at all, but do demonstrate high engagement with it. They are still of great value for your app.
You need to better understand your ROAS curve
Many factors come into play when it comes to understanding your ROAS curve. Before we get into that, I recommend you take a quick look at the image below, to familiarize yourself with who Happy Birds, Angry Birds, Late Bloomers, and Never Buyers are.

As you can see, the Happy Birds and Late Bloomers are the ones worth giving extra love to, as they are the ones with stronger LTV.
LTV is all the revenue a single user will generate from the time they download the app or game until they abandon the app altogether, which can happen anytime. Our casual gaming customers typically look beyond 90 days—going as far as six months, or even nine or twelve months ROAS. LTV is the main metric to consider when building a game, measuring the profitability of users against retention and identifying more lucrative user segments.
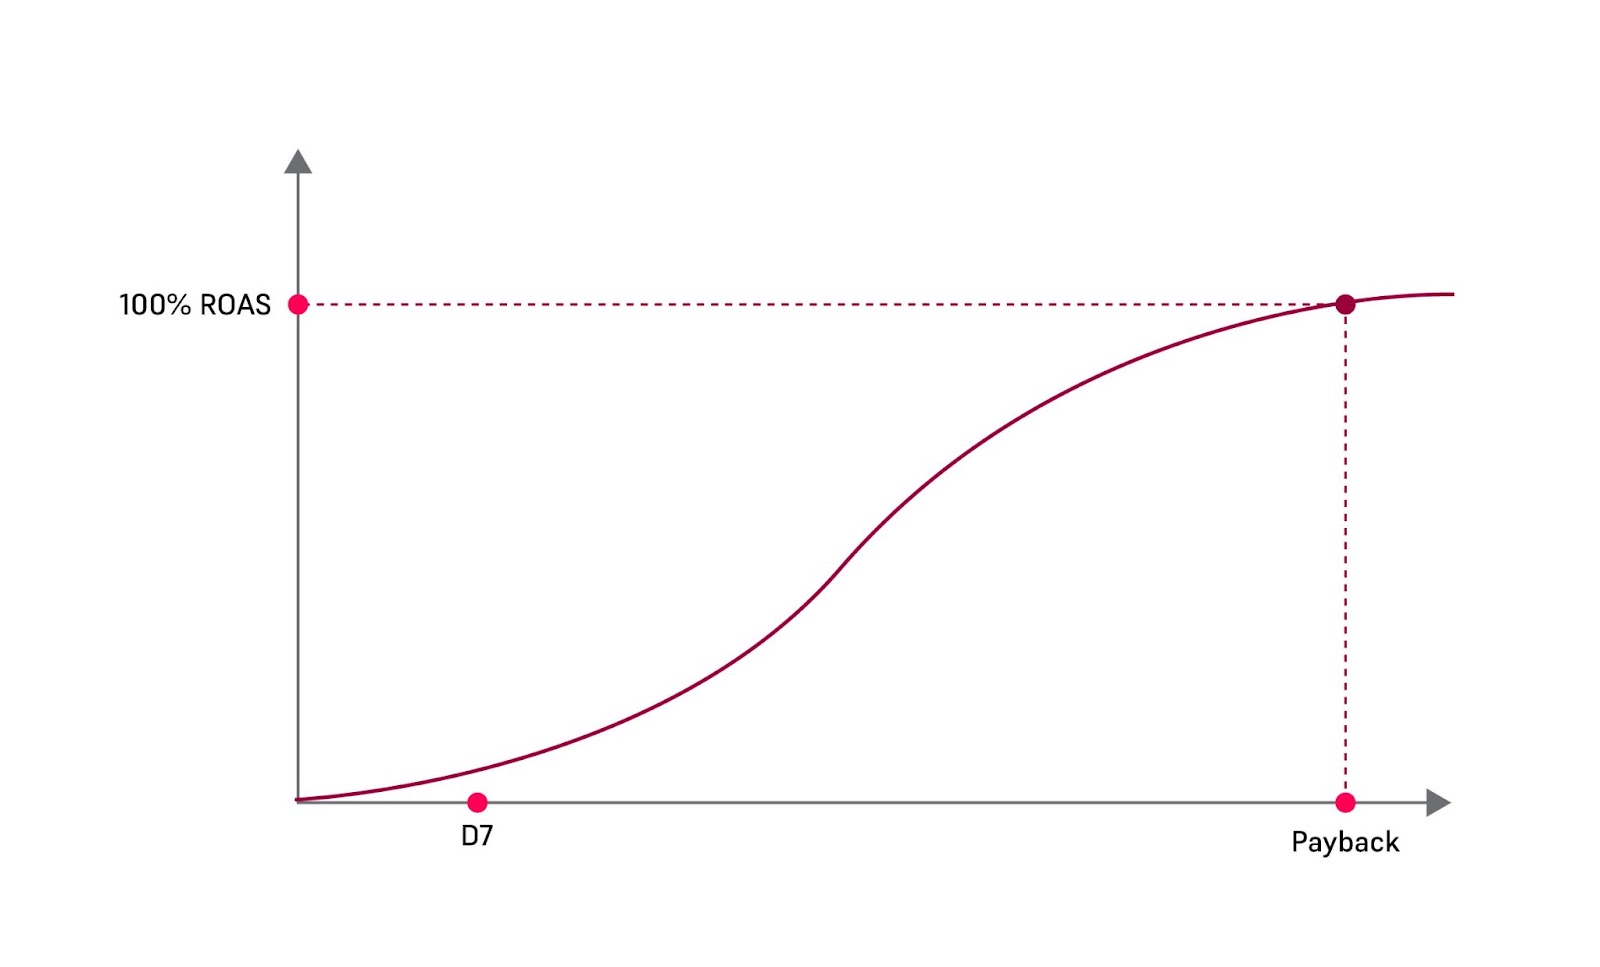
Now let’s look into how ROAS curves look for different game economies. We’ll start with how it looks when you push for early purchases, as seen in the graph below.

Early purchasers start off high, which is great. But then it plateaus—usually around the point of payback.
That leads me to the next graph, which showcases what it looks like when your game economy supports late purchases and/or small purchases over time.

See what I mean? 7-day ROAS didn’t fit the bill here, cause for these users, the real magic happens after day-7.
We can’t assume that all users make their purchases head-on in the beginning, because this graph shows a more balanced, and slower curve over time. This opens the lines for discussion on other things that need to be analyzed and understood uniquely by your team. For instance, why does the line look like that? Are those the same users that continue purchasing later on?

In the graph above, the thick line represents one of Voyantis’ own campaigns, and shows a more moderate angle and uplift because all targeting is based on LTV data—not just the 7-day window. Also, you can see that even though the ROAS is lower earlier on, it suppresses the 7-day campaign as time goes on.
This next graph offers a glance into how late bloomers behave, which can come in handy for your team regardless of whether you currently have campaigns to target them.
So yea, the reason the curve here looks the way it does is because late bloomers purchase well after the seven-day conversion window. They usually show how high engagement and retention rates during the early cohort days, but will mature to paying users later on the journey.
All in all, knowing the ROAS curve is the first stage that will help you with your optimization efforts, especially when it comes to unique per-user behaviors. It is also important to understand which percentage of your users are responsible for which percentage of revenue. Here at Voyantis, we saw this effect while analyzing the data of one of our own casual gaming customers. Our analysts were looking to see how many of their users were responsible for how much of the total revenue. Sure enough, 31 percent of the users of our client turned out to be responsible for 80 percent of their total revenue. and it is usually caused because they purchase over time.
Different traffic types and optimization models can impact the LTV curve in different ways
There are many factors to consider that can impact the LTV curve. Especially for casual gaming companies that specialize in mobile games. For instance, Facebook and Google offer sophisticated targeting capabilities that help casual gaming brands find the high cost / high intent users. On the flipside, incentivized channel users are quite the opposite — low cost and low intent. Meanwhile, rewarded video channel users are somewhere in between. Bear in mind, they are coming from other games, which by extension makes them a relatively qualified audience. They can be referred to as mid-cost / mid-intent users.
Location also plays a role in the LTV curve, considering the fact that users from different countries behave differently. For example, payers from lower GDP countries often behave similarly to payers from Tier 1 countries that come from incentivized channels.
When it comes to operating systems, it shouldn’t come as a surprise that there is a significant difference in performance between Android and iOS users when it comes to scale and quality. It is also worth noting that there is a notable difference in performance between different device models, such as lower-end and higher-end Android devices, considering that the performance varies significantly at different levels of spend. The U.S. leads with the highest cost for iOS and the second highest cost for Android. Overall though, Android is a hit with Casual gamers, offering bargain costs and Day 30 ROAS that beats iOS (and the global benchmark).

When it comes to the ROAS for global gaming apps between iOS and Android… iOS has a bit of an added edge, however it comes at four times the cost of an Android install.

This further stresses the importance for brands to make use of LTV predictive platforms, for hyper-targeting and ROAS optimization. This is especially the case for brands with access to an experienced data science team, engineering resources, and lots of data.
Hyper-targeting users with LTV predictive modeling
Growth teams can capitalize on optimization models to hyper-target only the users they want.
They can leverage media platforms’ new server-to-server APIs to send signals that represent LTV predictions to optimize their campaigns. They can also execute segmentation down to the individual level and target users who are most likely to bring the most value to the business. By using such a solution, growth marketers can manage and diversify their strategies on a sliding scale to balance risk-reward between short-term ROI and long-term LTV to achieve the best outcomes.
As we mentioned in a previous post, in many ways, user-level LTV prediction is akin to mining diamonds. LTV based optimization is no longer a matter of keep or kill campaigns or ads. The Facebook conversions API and Google’s Server-Side Tagging allows media buyers the integration that is essential to fire back server side signals, such as LTV, in order to optimize campaigns based on them (to be more specific and quite technical, it allows brands to share user-level signals, server to server, directly and not through the client endpoint device. Without it, sending an LTV score for optimization purposes is simply not possible). This new technology allows brands to send all sorts of new signals — offline conversions, time passed from a free trial, etc…The more sophisticated brands can use it to send LTV.
New AI-driven technologies empower user acquisition leaders to predict long-term profitability using third-party data alongside internal historical data without a large internal team of data scientists and programmers. They can enable your user acquisition team to optimize growth strategies, to be able to gain high-value users for long-term profitability without significant BI, data expertise, and R&D resources. By using such a solution, marketers can manage and diversify their strategies on a sliding scale to balance risk-reward between short-term ROI and long-term LTV to achieve the best outcomes.

.jpg)
.jpg)
.jpg)