

Free tool for PLG B2B’s: Ad Group Likelihood Simulator
June 22, 2022

If you’re one of the regular readers of our blog, you know we’re big on sharing tips, tricks, guides, cheatsheets—basically any and every type of resource to help make the lives of growth marketers a little easier. Because let’s face it, the roadblocks have been piling on since 2020, complicating growth efforts. So we decided to do a little something different this time around, and create a free tool for you and your marketing team, to estimate the likelihood of a campaign’s ability to yield high ROAS over time.
But first, let’s start by talking about why B2B growth marketers have a need for such a tool.
Too much has to be done too soon
The role of growth and marketing teams behind PLG B2B’s can easily be described as a juggle of struggles. The rhyme there might have sounded a little cute, but it’s actually a very serious matter.
I mean, there is the universal setback of the rise in CAC, which is creating quite the dent in marketing budgets—thereby placing growth teams in the position to do more with less. On the bright side, the marketers behind PLG B2B’s found some clever workarounds, to help reduce CAC.
Well that’s great, but when it comes to user acquisition campaigns, there are still some other small fires that need to be put out. Because until that is done, the profitability of PLG B2Bs will be affected. How? Issues are stemming from major decisions being made prematurely, based on partial data. And this is an issue that weighs more heavily on B2Bs, than B2Cs by a long shot.
There are a few reasons behind why this is the case. For starters, B2B’s typically have longer funnels than their counterparts due to things such as freemium options, free trials, and the like. As a result, there aren’t many conversions that take place within the first few weeks of acquiring new subscribers. That’s not to say there won’t be more conversions—just that PLG B2Bs need more time.
But (at the risk of sounding too deep), time waits for no one. At the end of the day, the marketing teams behind PLG B2B’s end up scrambling to make major campaign decisions based on early CAC/ROAS, and end up doing so using a basic model/rule of thumb which is based on historical averages. What they need is a little extra help in the form of predictive marketing, of which some elements can easily be done in-house.
But what if your team really needs some help in forecasting now? As in, RIGHT NOW?
Well, you got your friends at Voyantis for that. 😇 We decided to pay-it-forward, and create a special tool that you and your team can use right now. No strings attached.
We’ve got you covered
To help you better evaluate your campaigns early on, our fiercely talented data science team has created a very special tool for you. We’re calling it the ✨ Ad Group Likelihood Simulator ✨
As the name implies, by using this simulator, you’ll easily be able to estimate the likelihood of a campaign’s ability to yield high ROAS over time—simply by entering a few numbers!
{{banner}}
Note: Please make a copy of the simulator spreadsheet, so you can easily use it with your data.
How to use the simulator
Step 1
Based on your historical campaign data, fill in the quality group classification, which divides your campaigns to quality cluster groups 1-5, 5 being the best quality (with the highest probability to convert), 1 being the least favorable (lowest probability to convert).
Naturally, campaigns that have a higher probability to belong to the latter.
* if you don’t have this data available, ask your BI team to extract it for you by following the instructions below:
Choose the quality cluster group average conversions.
Let’s assume you have the history of 500 ad groups, and you are interested in conversions that happened within 12-months.
Option 1
- Take all of your 500 ad groups, and calculate the 10%, 30%, 50%, 70%, 90% percentiles of the 12-months conversion rate. These are the centers of your five cluster groups conversion rate
Option 2
- You know your marketing campaigns best, and know the rules of thumb on what CR constitutes a worse/bad/meh/ok/great group. Set the group threshold with that knowledge.
- For example, if you are a PLG freemium SaaS for teams, and your 12-months average CR is 0.5%, you’ll probably want to go for 0.05%, 0.2%, 0.5%, 1%, 2%
Probability of ad group to belong to this quality:
What is the probability of a campaign to belong to a certain quality group, based on historical data average?
To calculate this:
- Associate each of your ad groups with one of those buckets (by choosing the bucket with the closest conversion rate - e.g. if a specific ad group has 0.3%, we associate it with the bucket of 0.2% in option 2 above)
- Count the frequency for each cluster, to get the probability. So if 200 of the 500 ad groups were associated with the 0.05% cluster, the probability of an adgroup to belong to that cluster 200/500 = 40%
- Note that with option (1) the probability for each cluster should be around 20%
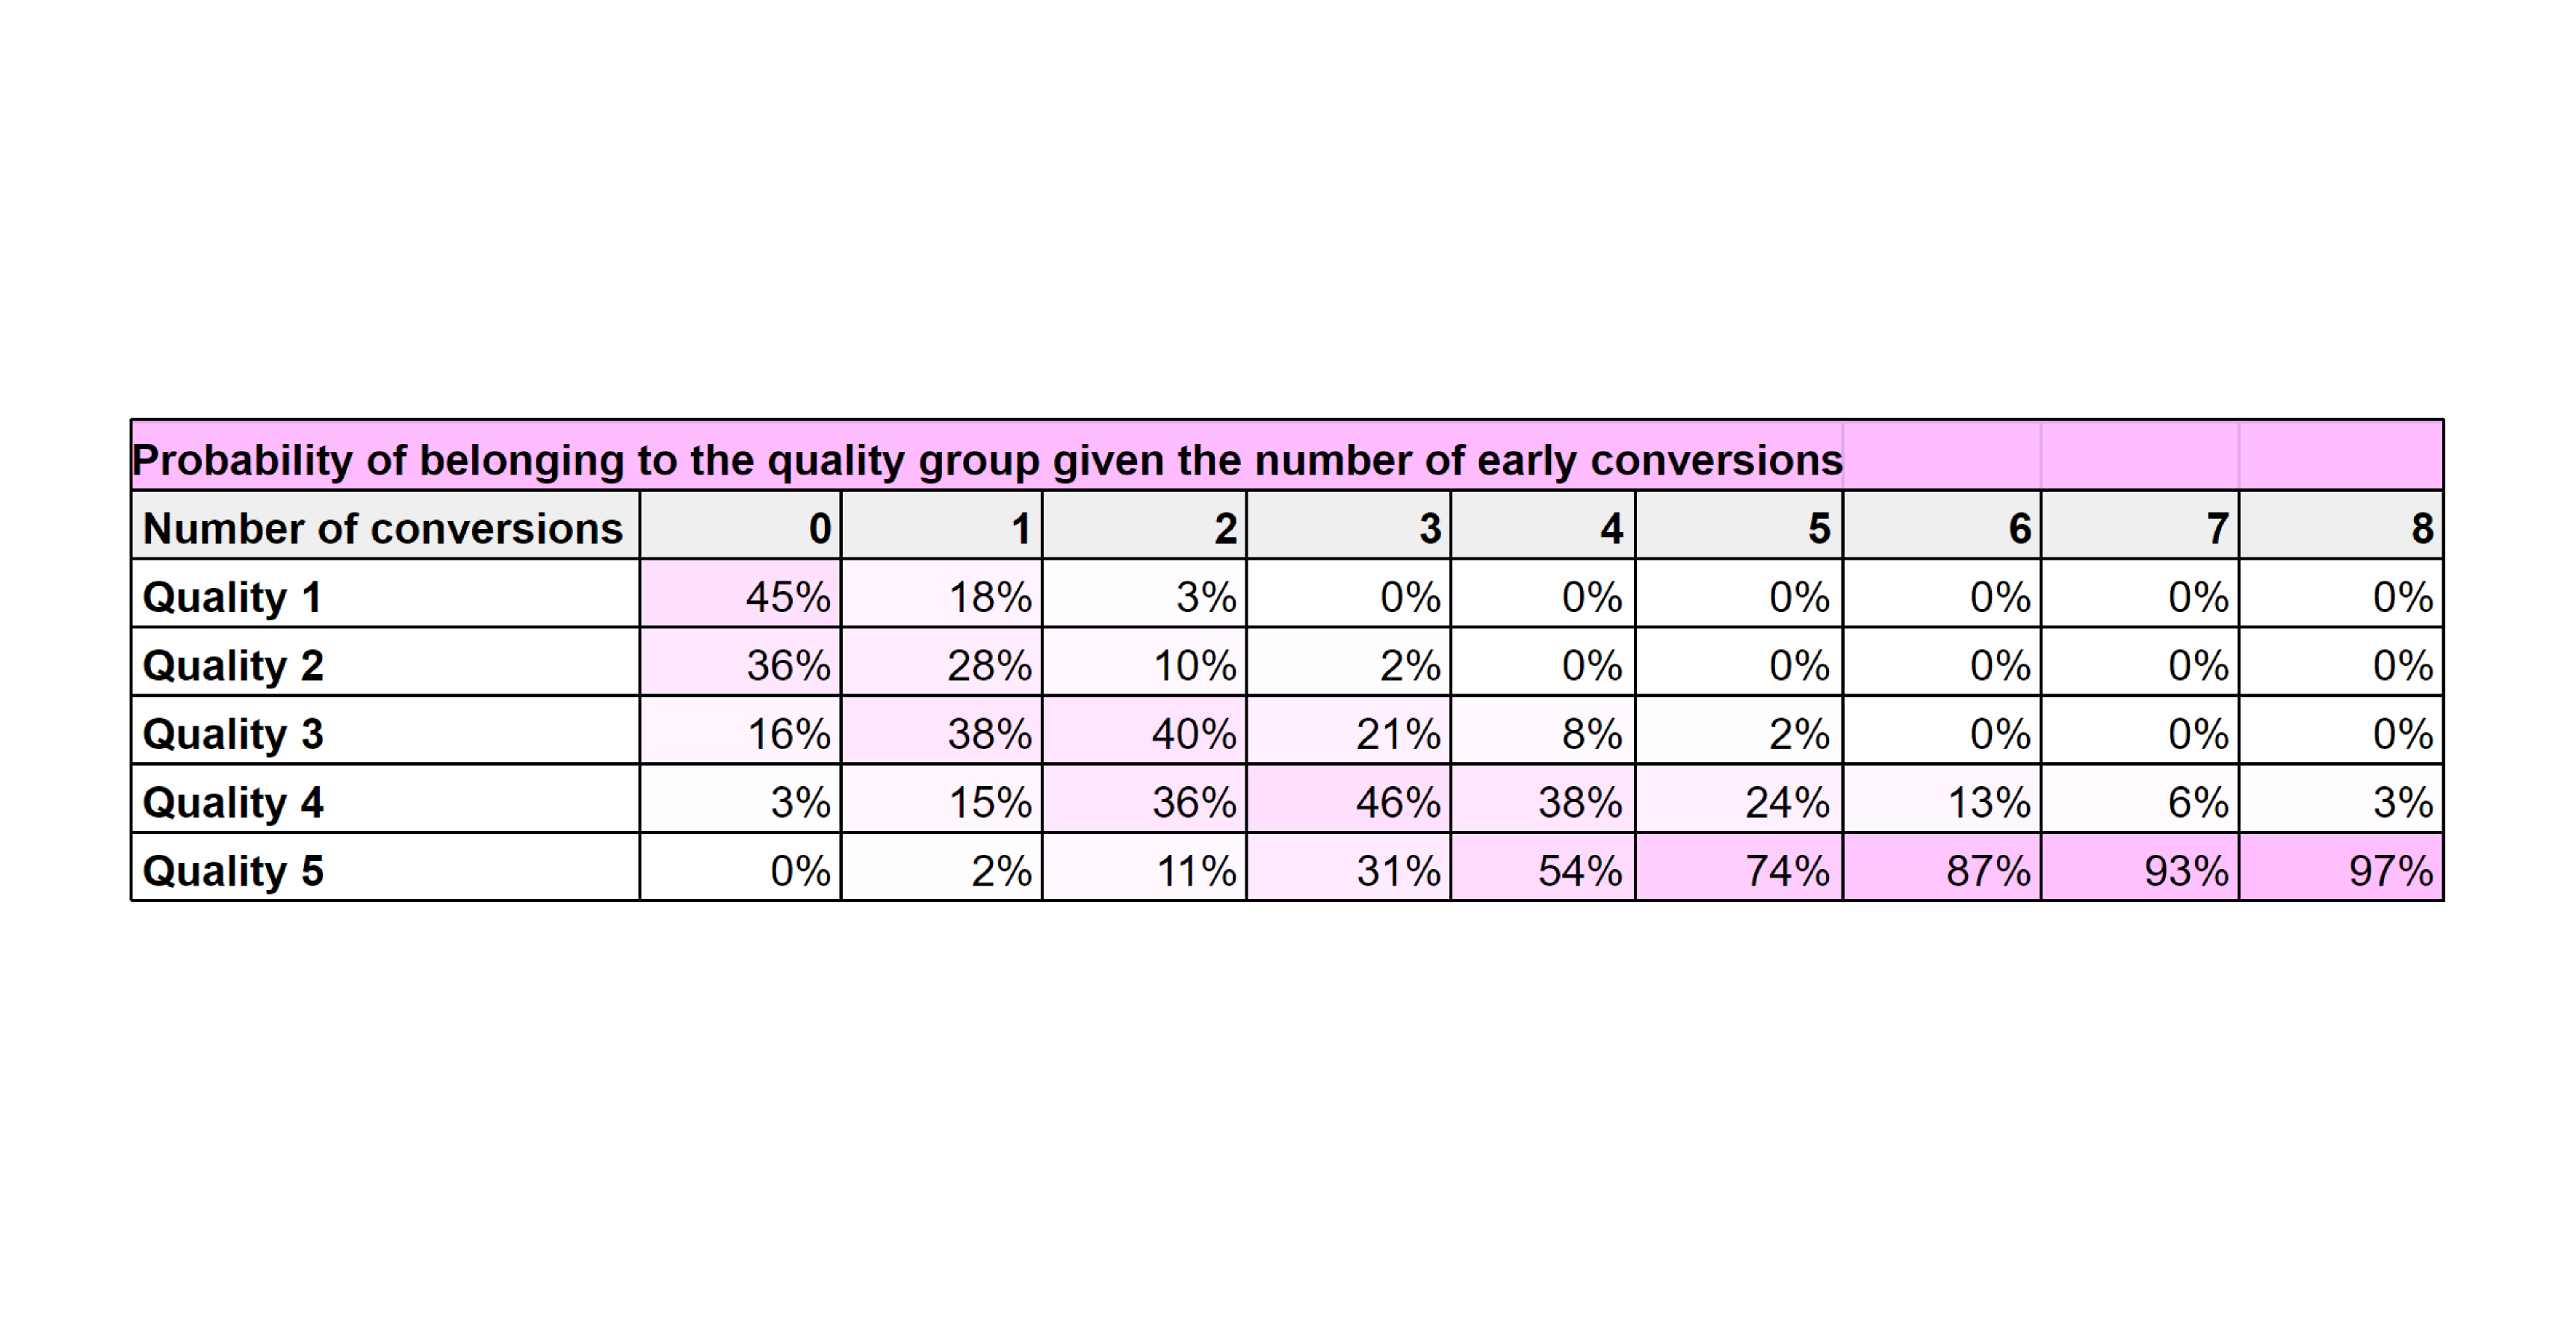
- As you can see on the example below, when split into 5 quality groups the % of belonging to the best group (5) are 5% on to the worse one (1) are 33%

Step 2 - Fill in the performance metrics to date of the specific campaign or adgroup’s cohort: the spend and the cost per subscriber

Step 3 - There is no step 3. This is where the magic begins, and you can sit back and better evaluate the chances of your campaign belonging to each one of the quality groups, with consideration to the number of conversions the campaign generated and observed to date.
In our example (using the data we entered on steps 1 + 2) if the ad group generated two conversions to date it’s most probable to belong to quality group 3 (40%!), if it generated three conversions, the quality ranking probability is number 4 (46%!).
As you can see (and as you know), every conversion counts!
A few words about the simulator:
Curious about why we bothered putting all this together in the first place?
We created this simulator because we understand that intuition around decision making on a small number of subscriptions in a cohort is SUPER sensitive to a single additional subscription.
This means that one simple subscription in a cohort that spent $5000 might doom or elevate a campaign or adgroup, incorrectly, and that can happen (too) frequently.
We wanted to generate something that provides a clearer, more continuous and less “quantized” decisioning mechanism.
We basically used a Bayesian modeling approach. This basically uses an approach of conditional probabilities to calculate the Maximum Likelihood candidate of the real CR/quality of the media source—so we can decide how much to bid on that source.
It's your turn now
Well there ya have it! You might want to bookmark this post, for easier reference.
All you have to do now is download the spreadsheet, make a copy, and follow the instructions we laid out above. Be sure to reach out on LinkedIn, Twitter, or Facebook if you have any questions!
.jpg)
.jpg)