

Do it in-house: Transitioning from 1-CAC-fits-all, to the value modeling approach
March 23, 2022
.jpeg)
In recent years, there have been a slew of changes in the growth marketing realm, especially for subscription SaaS B2B companies. From restrictions, to limitations, to straight up deprecations of features and functionalities that growth teams previously capitalized on. This was all a result of changes stemming from customer concerns, needs, and preferences.
So with all these changes in mind, it’s time for marketers to also change the way they optimize campaigns. Otherwise, the approaches of the past have become quite dated, and will only become increasingly (and needlessly) costly over time.

This is exactly why now is the time for marketing teams to switch from the one-CAC-fits-all approach (which was previously the industry standard) to the value modeling approach.
Now before I get into the value of value modeling (see what I did there?😂), let’s backtrack for a sec and talk about how campaign optimization is currently being handled.
The current state of B2B campaign optimization
Most B2B businesses get a directive from the CMO (sometimes even from the CFO) of what is expected to be the average target CAC, or average target ROAS. The B2B businesses typically aim to optimize for either Target Observable CAC (E.g: CAC < $1,200), or Target Observable ROAS (E.g: ROAS > 8 percent). The directive is to do so on the overall performance, which makes sense from an oversight perspective. However, marketers are taking this too literally. Hitting the target on average does not mean hitting the same target for each campaign!
Observable CAC/ROAS, as the name implies, refers to the CAC/ROAS observed on ad platforms shortly after acquisition. This zeros in on a cohort’s CAC within a day, few days, or a week from acquisition. At this stage the CAC will be very high and ROAS very low. This is because most subscription companies offer a free trial/freemium version, so it is natural to expect the conversion rate to be very low shortly after acquisition. We refer to this audience as “Late Bloomers,” and there are many perks that go hand-in-hand with targeting them, including lower acquisition costs, and diversification opportunities.
To get back to our point though—the benefit of using observable CAC/ROAS is that it is user friendly, simple, and rather immediate) for growth teams to apply. Marketers can use historical data to calculate the ARPU of teams and anchor rule of thumbs for CAC.
In a similar way they can analyze historical campaigns and set up ROAS expectation from new campaigns (what is a high performing ROAS, and what ROAS is too low to tolerate).
Comparatively speaking, advanced B2B businesses aim to optimize for projected values, which refers to the expected values in terms of acquisition costs. That is what we call “value modeling.”
Try to predict, at Day 1, what the pCAC (projected CAC) will be on day 90, and make a decision (on day 1) based on that projected number.
E.g.: pCAC@d90 < $700
Observable ROAS → Projected ROAS (pLTV/pROAS)
E.g.: pROAS @ Day 90 > 20%; Predict @ Day 1 or Day 7
I call this “projected” and not “predicted” as this is a rudimentary estimation, albeit a very useful one! I mean, all this is okay, but so much more potential awaits upon switching to value modeling.
{{banner}}
The benefits of value modeling
Over all, it is a better idea for marketers to consider transitioning to value modeling. Since B2B SaaS brands are targeting teams that can expand, the variability in the LTV of teams is much bigger than in consumer subscription businesses. That, in turn, makes relying on a simple average LTV something that is, in most of the campaigns, very far from the actual LTV in that campaign. Hence, value modeling can help capture that variability
An increasing number of marketers are wanting to switch to this approach to pay more for teams (or even simply campaign cohorts) of high value, and less for those with low value. Value modeling enables exactly that, during the limited conversion/decision window.
By nature, value modeling creates projection of the expected CAC/ROAS. While the marketer still evaluates and makes decisions on campaign’s cohort performance shortly after acquisition, the difference here is that the decisions are based on projections of expected CAC/ROAS on day 90, 180, or even 360.
With the value modeling approach, marketing teams can also calculate projected CAC for a greater variety of segmentations, such as regions, user’s device, and more.
Value modeling allows marketers to make more informed decisions that look beyond the first few days. In addition to paying for cohorts in accordance to their LTV, this approach also enables marketers to make more informed keep/kill decisions shortly after acquisition.
How to take on value modeling in-house
The good news here is that your team can easily take on value modeling in-house! Here’s what you need to do:

Start by calculating the ratio between paying teams on day 90, and paying teams on day 1. (Alternatively, you can also use day 180 or 360).
Be sure to take note of that final number, because you will need it to calculate the projected CAC. This can be done by using the following equation:

Allow me to explain the equation above. The projected number of paying teams at Day 90 is the observable number at Day 1, multiplied by the historical ratio between Day 1 and Day 90 (which you previously calculated and made note of because your friends at Voyantis told you to). The pCAC is then the spend, divided by that projected number of paying teams at Day 90..
Now here’s a quick course on how to use projected CAC:
- Let’s say XYZ is a SaaS B2B company
- Their CFO capped the CAC for paying teams at $600
- The marketing team ran a campaign with $20K spend
- On it’s first day the campaign yield was 15 paying teams
Their historical data from 2021 shows:
- XYZ spent $10M on Google search
- The campaigns yielded 4,000 paying teams by day 1
- The campaigns yielded 10,000 paying teams and 50,000 signed up teams by day 90
Now let’s analyze the new campaign using projected CAC:
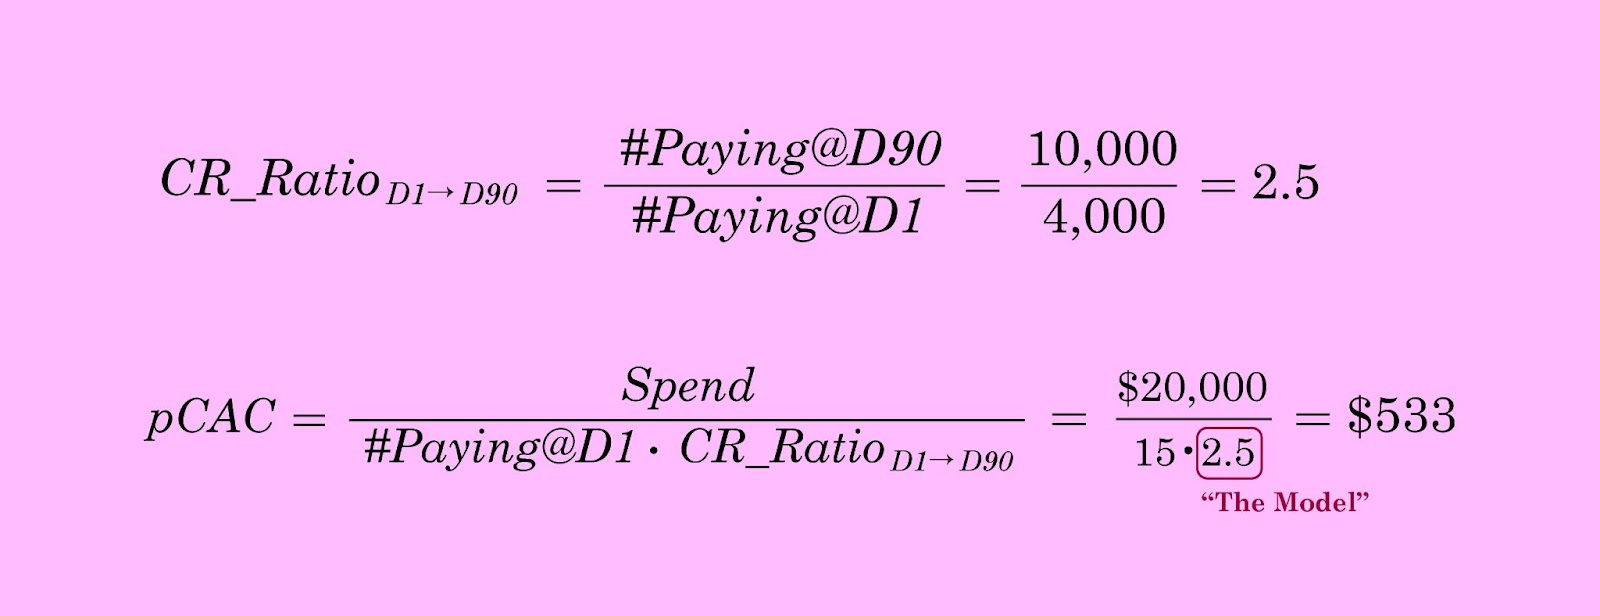
Based on the XYZ’s historical data, the projected CAC for this campaign (on day 90) is $533 for the paying team.
✨✨XYZ’s marketing team can now make more informed decisions in regards to the campaign's performance.✨✨
As you can see, once you obtain the final number, you will be one step closer to taking things up another notch, which would be the projection of ROAS/LTV, which can be improved by calculating the D1->D90 ratio for different geos separately.
Stay tuned for part 2 of this series for more on that!

.jpg)
.jpg)
.jpg)